
LoadTester
LoadTester lets you improve performance iteratively by running and refining HTTP load tests with live analytics and no infrastructure to manage.
Visit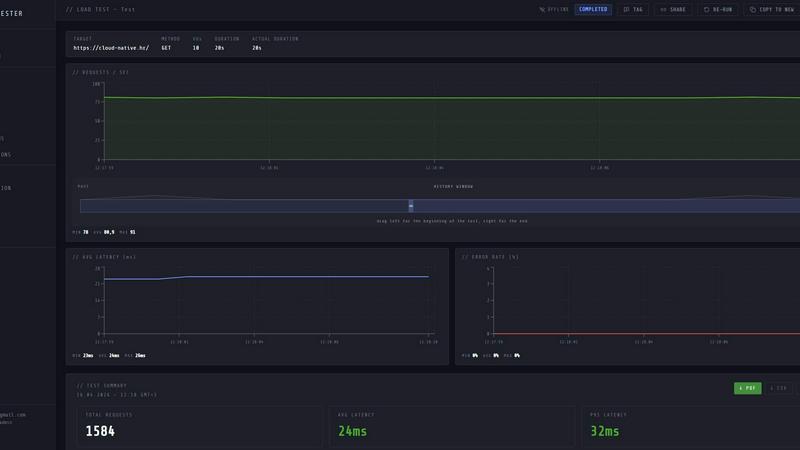
About LoadTester
LoadTester is a modern HTTP and API load testing tool built by Cloud Native d.o.o. for engineering teams that need repeatable performance checks. It removes the painful parts of performance testing, such as setting up infrastructure, orchestrating workers, and managing complex scheduling, while keeping the workflows developers actually care about. With LoadTester, you can run application and HTTP load tests in minutes directly from your browser or CI/CD pipeline, without any infrastructure to provision. The tool provides live analytics, p95 and error rate thresholds, scheduled baselines, and run to run comparisons. It is designed for teams that want simple, repeatable performance checks to catch performance regressions before users notice. LoadTester supports distributed load tests with automatic worker scaling, cold starts under 3 seconds, and auto stop based on failure or latency thresholds. It includes exports, scheduled tests, API access, and workflow integrations. A free plan is available for teams to get started quickly. Whether you are testing a checkout spike, an auth flow baseline, or a search endpoint, LoadTester gives you the data you need to ship with confidence and prove capacity before launch.
Features of LoadTester
Instant Execution, Distributed by Default
Start distributed load tests in seconds with no infrastructure setup, no worker orchestration, and no scheduling headaches. LoadTester handles worker scaling, infrastructure coordination, and execution flow automatically. With a cold start time of under 3 seconds and auto scaling workers, your team focuses on results while the platform manages the distributed execution. Tests start fast with up to 8 workers dispatched instantly, and the queue time is effectively zero milliseconds. This feature eliminates the need for teams to provision and manage their own load testing infrastructure, making performance testing accessible to any engineering team.
Live Analytics and Telemetry
Watch requests, latency, failures, throughput, and bottlenecks in real time while your test is running. LoadTester provides live charts that show throughput, latency, active users, and errors updating continuously during the run. You can see RPS, P50, P95, and P99 latency metrics updating live, along with success rates and error counts. The latency distribution chart shows the last 60 seconds of data, allowing you to spot trends and anomalies immediately. This real time visibility means you are not waiting 5 minutes after the run to see what happened, enabling you to make informed decisions during the test itself.
Smart Auto Stop with Thresholds
Set failure or latency thresholds and automatically stop tests when things go sideways. LoadTester allows you to configure guardrails for P95 latency, error rates, and regressions versus baselines. For example, you can set an auto stop condition when P95 latency exceeds 400 milliseconds or when the error rate goes above 2 percent. You can also set regression alerts that notify Slack and email when performance degrades by more than 15 percent compared to a baseline run. Additionally, webhooks can be triggered on completion to post result links to release bots. This feature ensures that problematic tests are stopped immediately, preventing wasted time and resources.
CI/CD Ready with Webhooks and Slack and Email Alerts
Run tests on every deploy with seamless CI/CD integration. LoadTester is designed to fit into your existing workflow with webhooks, Slack alerts, and email notifications. You can schedule tests to run daily at specific times, such as a nightly release gate at 02:00 UTC. The platform provides shareable outputs in PDF, CSV, or JSON formats so the team can access the numbers they need. This automation and integration capability makes LoadTester a natural part of your continuous improvement cycle, allowing you to catch performance regressions before they reach production.
Use Cases of LoadTester
Spike Testing for Ecommerce Checkout Flows
Run spike tests on critical ecommerce endpoints like checkout to ensure your application can handle sudden bursts of traffic. With LoadTester, you can create a test named Checkout spike test using the POST method targeting api.example.com/checkout. Set the mode to requests per second with a rate of 500 rps for a duration of 300 seconds. Monitor live metrics such as RPS reaching 4,812, P95 latency at 184 milliseconds, and a success rate of 99.8 percent. By running these tests regularly, you can identify bottlenecks and ensure your checkout flow remains performant during peak shopping periods, preventing lost revenue and poor user experience.
Baseline Performance Monitoring for Auth Flows
Establish and monitor baseline performance for authentication endpoints to detect regressions early. Create a baseline test for the GET method on api.example.com/auth/me with a target of 248 RPS and 41ms P95 latency. Schedule this test to run daily and compare results against the established baseline. LoadTester will alert you via Slack and email if performance degrades by more than 15 percent, allowing your team to investigate and fix issues before they impact users. This iterative monitoring approach ensures that auth flows remain fast and reliable as your application evolves.
Search Endpoint Capacity Planning
Validate the capacity of search endpoints before launching new features or marketing campaigns. Run tests on the GET method targeting api.example.com/search with a target of 1,240 RPS and 96ms P95 latency. Use LoadTester to simulate realistic user behavior and measure how the search functionality performs under load. The live analytics and auto stop thresholds help you identify the maximum capacity of your search infrastructure. With this data, you can make informed decisions about scaling resources and ensure that search remains responsive even during high traffic events.
Release Gate Testing in CI/CD Pipelines
Integrate LoadTester into your CI/CD pipeline as a release gate to prevent performance regressions from reaching production. Schedule nightly tests at 02:00 UTC that run against your staging environment. Configure thresholds for P95 latency, error rates, and regressions versus baselines. If any threshold is breached, the test automatically stops and alerts the team via Slack and email. The webhook on completion can post the result link to your release bot, providing a clear pass or fail status. This continuous improvement cycle ensures that every deploy is validated for performance before it reaches users.
Frequently Asked Questions
How do I start a load test with LoadTester?
Starting a load test with LoadTester is simple and fast. First, create a new test by providing a name, selecting the HTTP method (GET, POST, PUT, DELETE), and entering the target URL. Choose your mode between virtual users or requests per second, then set the rate and duration. Once configured, launch the test instantly from the dashboard. LoadTester handles all infrastructure coordination, dispatching workers automatically. You will see live metrics within seconds, including RPS, latency, errors, and active users. There is no bloated setup or platform ceremony required.
What metrics can I monitor during a live test?
During a live test, LoadTester provides a comprehensive set of real time metrics. You can monitor requests per second with a trend indicator showing percentage change, P50 latency, P95 latency, P99 latency with SLO status, and success rate with error counts. The latency distribution chart shows the last 60 seconds of data for p50, p95, and p99. Additionally, you can see total requests, errors, worker count, and the current test status. All these metrics update continuously during the run, giving you full visibility into your application's performance under load.
Can I schedule tests to run automatically?
Yes, LoadTester supports scheduled tests that run automatically at specified times. You can configure tests to run daily at a specific time, such as a nightly release gate at 02:00 UTC. These scheduled tests can include thresholds for auto stop and regression alerts. When a scheduled test completes, results are available for review and comparison with previous runs. This automation is ideal for continuous performance monitoring and regression detection, ensuring that your application remains performant without manual intervention.
How does LoadTester handle test failures and thresholds?
LoadTester provides smart auto stop functionality based on configurable thresholds. You can set guardrails for P95 latency, error rates, and regressions versus baselines. For example, you can configure an auto stop condition when P95 latency exceeds 400 milliseconds or when the error rate goes above 2 percent. You can also set regression alerts that notify Slack and email when performance degrades by more than 15 percent compared to a baseline run. When a threshold is breached, the test stops automatically, preventing wasted resources and allowing your team to investigate immediately.
Pricing of LoadTester
LoadTester offers a free plan that allows teams to get started with load testing immediately. The free plan includes the ability to run tests, monitor live analytics, and review completed results. For teams that need higher limits, scheduled tests, API access, and workflow integrations, LoadTester provides paid plans with tiered pricing based on usage. The exact pricing details, including specific plan tiers and costs, are available on the LoadTester pricing page. Users can start with the free plan and upgrade as their testing needs grow.
Similar to LoadTester


GPT Image 2 API generates and edits production-ready images with clear text, reference images, and developer-friendly API workflows.

Pay-as-you-go e-signature API and no-code sending. €0.049 per envelope, no monthly minimums, legally valid in 55+ countries.

Ornold MCP lets AI agents control Chromium and antidetect browsers: click, type, read screens, record workflows, replay profiles without scripts.


AIQualityHQ instantly evaluates and improves your AI prompts across six core dimensions for safer, more reliable outputs.