
GeoRank
GeoRank compares places on sunshine, cost, tax, and visas, then lets you ask AI about your shortlist to end relocation research.
VisitPublished on:
July 13, 2026
Pricing:
About GeoRank
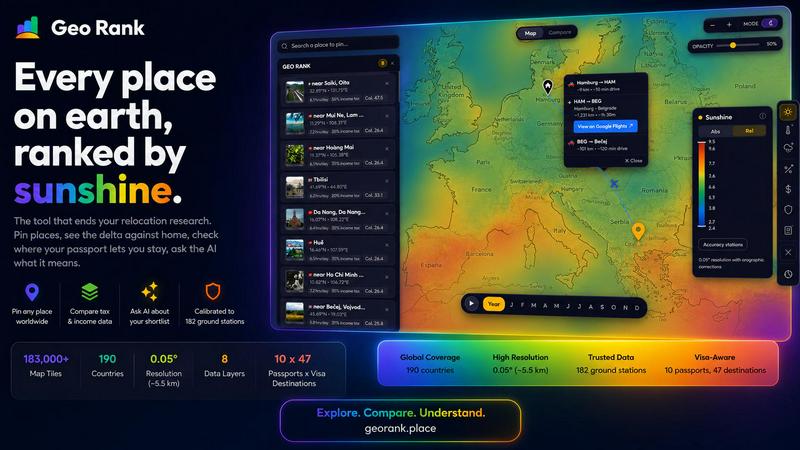
GeoRank is a free, no-signup interactive map tool that replaces the chaotic, multi-tab research process of deciding where to relocate or spend an extended stay abroad. It is built for digital nomads, remote workers, expats, and anyone considering a move who is tired of juggling a weather site, Numbeo, embassy pages, and nomad forums that never communicate with each other. The product layers eight distinct data sets over a global grid with approximately five-kilometer resolution, offering a unified decision tool. These layers include sunshine and temperature data calibrated against 182 ground stations using SARAH-3, ERA5, and CHELSA sources, tax rates from OECD, PwC, and KPMG, per-passport visa and residency routes across 47 destinations for 10 passports, cost-of-living data from 478 cities, geopolitical risk, and community-sourced Nomad Pulse sentiment. Users can pin candidate places, switch to Compare mode to see every metric as a delta against their current home, and ask an AI assistant that reasons only over their own shortlist. GeoRank is designed for the actual, high-stakes decision of where to live next, not just for browsing data. It provides a cyclical, iterative process where users explore globally, refine their choices with comparisons, and continuously improve their understanding through grounded AI answers.
Features of GeoRank
Explore Globally with Live Data Layers
GeoRank provides nine live data layers that users can toggle on and off to explore the entire world. These layers include sunshine, temperature, rainfall, outdoor hours, taxes, visas and residency, cost of living, geopolitical risk, and Nomad Pulse sentiment. Users can pan across the globe and zoom in to approximately five-kilometer cells, allowing for granular analysis of any location. Each layer is backed by a specific methodology, such as SARAH-3 satellite data for sunshine or OECD tax databases, ensuring the information is both accurate and actionable. This feature enables users to stack multiple layers simultaneously, seeing how tax rates correlate with sunshine hours or how visa restrictions align with cost of living in a single view.
Pin and Compare Against Home
Once a user finds an interesting location, they can click to pin it, saving up to 20 places across sessions. The true power of this feature emerges in Compare mode, where users set their current home as a baseline. Every pinned location then shows a delta against that baseline: how many more sunshine hours, how much cheaper the cost of living is, how much lower the tax burden is, or how much safer the geopolitical risk rating is. This relative comparison transforms absolute numbers into personally meaningful insights, allowing users to see not just what a place offers, but how it stacks up against their current reality. The data persists across sessions, enabling iterative research over days or weeks.
AI Assistant for Your Shortlist
GeoRank includes an AI chat feature that operates exclusively on a user's pinned locations, not on a generic knowledge base. The AI is grounded in the specific data layers for each pinned place. Users can ask questions like "Which of my 5 places has the best winter?" or "Score my shortlist: sunshine, cost, and low tax combined," and receive answers that reason across all pinned locations in one response. Each answer cites its sources from the GeoRank data, such as SARAH-3 sunshine data or OECD tax rates, ensuring transparency and trust. This feature enables a cyclical process of asking, learning, and refining the shortlist without leaving the map.
Nomad Pulse Community Sentiment
Unlike traditional data sources that rely solely on official statistics, GeoRank includes Nomad Pulse, a layer that tracks weekly sentiment from the digital nomad community. This data is processed from social posts and other community signals, categorized into rising, stable, or falling trends per country and city. This feature provides an early warning system for emerging hotspots or declining destinations, giving users a competitive edge in their relocation planning. It allows for continuous improvement of a shortlist based on real-time community feedback, not just static historical data.
Use Cases of GeoRank
Comparing Two Candidate Cities for Relocation
A digital nomad on a UK passport is torn between Tbilisi, Georgia, and Paphos, Cyprus. Using GeoRank, they pin both locations, set their current home in London as the baseline, and switch to Compare mode. They immediately see that Paphos offers 3,140 sunshine hours per year versus Tbilisi's 1,987, and that the UK passport allows 360 days visa-free in Tbilisi but only 90 out of 180 days in Paphos. The cost of living in Tbilisi is around 900 dollars per month compared to 1,600 dollars in Paphos. They then ask the AI, "Which works better for a freelancer wanting low tax and at least 2,800 sunshine hours?" The AI reasons that Tbilisi fails the sunshine threshold, while Paphos meets it and offers a well-established non-dom tax regime, though at a higher cost.
Finding a Winter Base with Optimal Conditions
A retired couple wants to escape the cold Canadian winter for three months. They use GeoRank to pin five potential destinations across Southeast Asia and South America. They set their home in Toronto as the baseline and examine the temperature and sunshine layers. They ask the AI, "Which of my pinned places has the best winter climate?" The AI analyzes the temperature and sunshine data for all five locations, identifying the one with the most stable warm temperatures and highest sunshine hours during the months of December through February. The couple can then refine their shortlist by checking the visa layer to see how long their Canadian passport allows them to stay in each country.
Evaluating Tax Implications for a Remote Worker
A US-based remote worker is considering moving abroad to reduce their tax burden. They use GeoRank to pin several countries known for favorable tax regimes for foreign-sourced income, such as Panama, the UAE, and Portugal. By toggling the tax layer, they see the specific income tax rates for each location, sourced from OECD and PwC data. They set their home in New York as the baseline and see the delta in tax rates. They then ask the AI, "What are the tradeoffs between these three places regarding tax and cost of living?" The AI provides a comparative analysis, noting that while the UAE has zero income tax, the cost of living is higher than in Panama, and Portugal offers a special tax regime for remote workers but with specific application requirements.
Assessing Safety and Stability for a Family Move
A family with young children is considering a move from London to either Lisbon or Kuala Lumpur. They use GeoRank to examine the geopolitical risk layer, which provides a safety rating for each region. They also check the cost of living layer to compare housing and education costs. By setting London as their home base, they see that Kuala Lumpur is significantly cheaper and has a comparable geopolitical risk rating to Lisbon. They ask the AI, "Which location is safer for a family with children?" The AI analyzes the geopolitical risk data and also considers the nomad pulse sentiment to see if there are any recent concerns in either city. The family can then make an informed decision based on a holistic view of safety, cost, and community feedback.
Frequently Asked Questions
How does GeoRank calibrate its sunshine data?
GeoRank does not rely on raw satellite data alone, which can overestimate sunshine in cloudy regions. Instead, it merges SARAH-3 satellite observations with ERA5 reanalysis data and then bias-corrects this against 182 ground stations with orographic terrain corrections. This calibration process covers locations from Reykjavik to Phoenix to Sydney, ensuring an accuracy of plus or minus eight percent for most locations, though high-altitude and coastal microclimates may have a larger margin of error.
Do I need to create an account or sign up to use GeoRank?
No, GeoRank is completely free and requires no signup or account creation. Users can access the interactive map, toggle all nine data layers, pin up to 20 locations, use the Compare mode, and ask the AI assistant without providing any personal information. The pinned locations are saved across sessions using local browser storage, allowing for iterative research over time without any commitment.
What passports and visa destinations are covered in the visa layer?
The visa and residency layer currently covers 10 different passports and 47 visa destinations. This allows users to see how their specific passport affects their ability to stay in a candidate location, including visa-free days, visa-on-arrival options, and residency routes. The data is sourced from official embassy pages and is updated regularly to reflect the latest changes in visa policies.
How often is the Nomad Pulse sentiment layer updated?
The Nomad Pulse layer tracks weekly sentiment from the digital nomad community. It processes social posts and other community signals to generate a signal of whether sentiment is rising, stable, or falling per country and city. This layer is updated on a weekly basis, providing users with current insights into where enthusiasm is building or declining, which can be a leading indicator for a location's popularity and livability.
Similar to GeoRank

Privacy-first, cookieless web analytics that ties your traffic and marketing channels to real Stripe revenue.

Signage and kiosk infrastructure for AI agents. Your agent publishes images, video, streams, web pages and apps to screens via one plugin.screenRIG is

Genjutsu AI turns your ideas into cinematic videos, product ads, social shorts, and high-quality images in minutes.

Novastart brings apps and files onto an infinite canvas where people and AI agents can work together.

Moderation, routing, intent and scoring for any text over one Jev-compatible API, hosted in the EU.


Visual financial timelines for couples and young professionals.
