Dividend Data vs Tailride
Side-by-side comparison to help you choose the right product.
Dividend Data
Automate your investment research with instant stock data and 30+ years of history directly in your spreadsheets.
Last updated: March 11, 2026
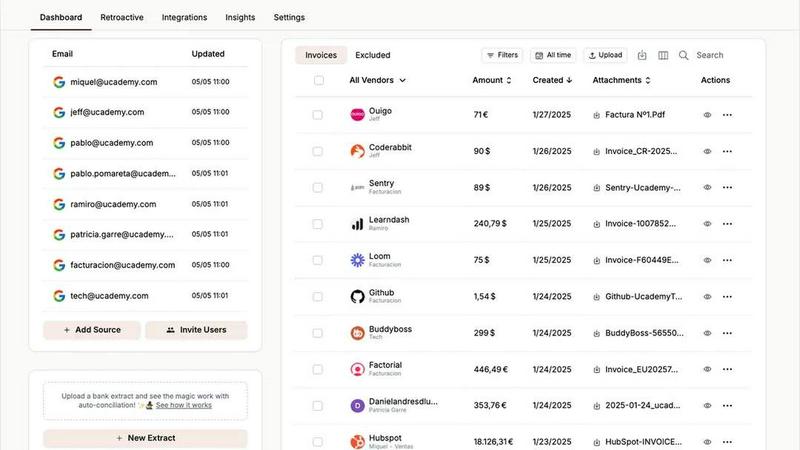
Tailride
Tailride automates invoice and receipt management from your inbox, saving you time and simplifying accounting tasks.
Last updated: February 26, 2026
Visual Comparison
Dividend Data

Tailride
Feature Comparison
Dividend Data
Comprehensive Spreadsheet Integration
Dividend Data seamlessly integrates with both Google Sheets and Microsoft Excel through dedicated add-ins, requiring no API keys or coding knowledge. Users access data by typing intuitive custom formulas directly into their cells, which then pull live, updated information from Dividend Data's extensive databases. This feature automates the entire data collection process, transforming static spreadsheets into dynamic, always-current financial models that refresh with a simple recalculation, fostering a cycle of continuous improvement in your analysis.
Extensive Historical & Real-Time Data Library
The platform provides deep historical context with over 30 years of market data across more than 80,000 global tickers. Investors can pull not just current quotes but also decades of dividend history, financial statements, and key ratios. This vast historical depth is crucial for performing robust trend analysis, calculating long-term growth rates, and backtesting investment strategies, enabling a more informed and iterative approach to building and validating financial theses.
Curated Functions for Dividend Investors
Dividend Data offers 16 specialized custom functions tailored specifically for the needs of income and fundamental investors. Formulas like DIVIDENDDATA_DIVIDENDS for forward yield and ex-dates, DIVIDENDDATA_RATIOS for valuation metrics, and DIVIDENDDATA_METRICS for fundamental data ensure users get precisely the data points they need without sifting through irrelevant information. This curated approach streamlines the research process, allowing for faster, more focused analysis and decision-making.
AI-Powered Research & Portfolio Tools
Beyond spreadsheets, the Dividend Data Terminal web-app enhances the ecosystem with AI-powered research capabilities and automated portfolio tracking. The AI Analyst acts as a research assistant, while the portfolio tool automatically aggregates holdings, tracks dividend income, and visualizes performance. This creates a virtuous cycle where spreadsheet analysis informs portfolio decisions, and portfolio data feeds back into analytical models for ongoing optimization.
Tailride
Inbox Scanning
Tailride’s inbox scanning feature allows users to find any invoice in their inbox within seconds. This robust functionality replaces the need for numerous receipt management apps, providing a comprehensive solution that connects natively to your email. It monitors incoming invoices, ensuring that nothing is overlooked, regardless of format—PDFs, images, or text within emails.
Online Portals
The platform simplifies invoice extraction from various online portals, such as e-commerce and service platforms. Users can easily gather invoices from websites without the hassle of manual tracking. Tailride streamlines this process, making it easier for business owners to manage their accounts efficiently, freeing them to focus on other essential tasks.
AI Processing
Tailride employs sophisticated AI processing to intelligently recognize and categorize invoices and receipts. This feature ensures that documents are accurately processed and organized without the need for manual input. Customizable AI rules allow users to tailor categorization to their specific business needs, increasing efficiency and accuracy in financial documentation.
Reconciliation
With Tailride's reconciliation feature, users can effortlessly match transactions with invoices to identify any discrepancies or missing documents. This essential functionality enhances financial oversight and simplifies the reconciliation process. The integration with popular accounting software ensures a smooth workflow, allowing businesses to maintain accurate financial records with ease.
Use Cases
Dividend Data
Building Dynamic Dividend Screens
Investors can construct powerful, custom stock screens directly in their spreadsheet. By combining functions for dividend yield, payout ratio, consecutive years of growth, and PE ratio, users can create a live filter that updates automatically as market data changes. This allows for the continuous monitoring of investment criteria and the iterative refinement of a watchlist based on the most current financial metrics available.
Creating Automated Financial Models
Analysts and individual investors can build detailed discounted cash flow (DCF) or dividend discount models (DDM) that pull live data for revenue, EPS, and dividend forecasts directly into their assumptions. This automates the input stage, letting modelers focus on analysis and scenario planning. The model becomes a living document that improves in accuracy and relevance with each data refresh.
Maintaining a Live Portfolio Dashboard
Users can link their portfolio holdings in a spreadsheet to pull real-time prices, dividend announcements, and yield-on-cost calculations. This creates an automated dashboard that tracks total value, income projections, and sector allocation without manual updates. It enables a cycle of continuous portfolio review and rebalancing based on live, aggregated data.
Conducting Historical Comparative Analysis
With access to 30+ years of data, investors can perform deep historical studies, such as analyzing a company's dividend consistency through different economic cycles or comparing the historical volatility and performance of multiple assets. This long-term perspective supports more resilient, iteratively-tested investment strategies grounded in comprehensive historical evidence.
Tailride
Efficient Invoice Management for Accountants
Accountants managing multiple clients can leverage Tailride to automate invoice extraction from various email accounts. By centralizing invoice management, they can significantly reduce the time spent on manual data entry and focus on providing strategic advice to their clients.
Streamlining Expense Tracking for Employees
Employees can utilize Tailride to keep track of their expenses by sending images of physical receipts directly to the platform via Telegram or WhatsApp. This functionality allows for easy expense submission and ensures that all receipts are accurately captured and organized for accounting purposes.
Simplifying Year-End Financial Processes
As the year-end approaches, businesses can rely on Tailride to quickly gather all invoices from their inboxes. The ability to retroactively search and organize invoices enables teams to efficiently prepare for audits or financial reviews without the stress of missing documents.
Enhancing Workflow Automation for Businesses
Tailride’s customization options allow businesses to set specific AI rules for their invoicing needs. By automating workflows, companies can ensure that all invoices are captured without manual intervention, saving hundreds of hours in the process and allowing teams to concentrate on growth and development.
Overview
About Dividend Data
Dividend Data is a powerful financial data platform designed to empower fundamental and dividend investors with institutional-grade market intelligence directly within their existing workflow. At its core, it eliminates the tedious, error-prone process of manually copying and pasting data by bringing over 30 years of historical stock market data for more than 80,000 tickers straight into Google Sheets and Microsoft Excel. The platform operates on a simple, code-free principle: just type a custom formula like =DIVIDENDDATA_DIVIDENDS("MSFT"), and live data instantly populates your cell. Built by a dividend investor for dividend investors, it provides instant, structured access to critical metrics including dividends, yields, payout ratios, growth rates, complete financial statements, earnings, valuation ratios, and price history through a suite of over 100 metrics. This continuous, iterative flow of data into your spreadsheets allows for dynamic, living models that improve with every refresh, ensuring your investment analysis is always based on the latest information. With a generous free tier offering 2,500 monthly credits and no trial expiration, Dividend Data makes professional-grade analysis accessible to every investor, bridging the gap between sophisticated data needs and a user-friendly, affordable price point.
About Tailride
Tailride is an innovative AI-powered accounting automation platform designed to streamline the tedious task of invoice management. By connecting directly to your email inbox, it automatically detects and extracts invoices and receipts from both emails and attachments, utilizing advanced intelligent document recognition. This powerful tool is ideal for businesses and accountants looking to save time and minimize manual data entry. Tailride also features a Chrome extension that facilitates one-click invoice extraction from over 20 platforms, including Amazon, Meta Ads, and Notion. With customizable AI rules for automatic categorization, seamless integrations with popular accounting software like QuickBooks and Xero, and comprehensive bank reconciliation capabilities, Tailride empowers users to focus on strategic financial decisions rather than getting bogged down in paperwork. Experience the future of accounting automation with Tailride and reclaim hundreds of hours each month.
Frequently Asked Questions
Dividend Data FAQ
How does the free tier work?
The free tier provides 2,500 credits per month, which do not expire and renew each month. No credit card is required to start. Each data point retrieved by a formula (e.g., one cell with a dividend yield) typically consumes one credit. This generous allowance allows for substantial usage for personal portfolio tracking and analysis, enabling users to experience and iteratively integrate the tool into their workflow at no cost.
What data can I access with the spreadsheet functions?
You can access over 100 key metrics including forward and historical dividends, ex-dividend dates, dividend yields, payout ratios, stock prices, PE ratios, EPS, full financial statement items (income statement, balance sheet, cash flow), and various other growth and valuation metrics. The 16 custom functions are designed to categorize this data intuitively for fundamental and dividend analysis.
Do I need to know how to code to use Dividend Data?
Absolutely not. Dividend Data is built specifically to require zero coding. You use it just like any native spreadsheet function (e.g., =SUM()). Simply type =DIVIDENDDATA_ and follow the formula syntax to pull data directly into your cell. The integration handles all the complex data fetching in the background, making professional analysis accessible through an interface you already know.
Does it work in both Google Sheets and Microsoft Excel?
Yes, Dividend Data offers fully functional add-ins for both Google Sheets (via the Google Workspace Marketplace) and Microsoft Excel (via Microsoft AppSource). The core experience and formula syntax are consistent across both platforms, allowing you to choose your preferred environment or even use both interchangeably while maintaining a continuous, iterative analysis process.
Tailride FAQ
How does Tailride connect to my email?
Tailride integrates natively with your email account, allowing it to monitor and extract invoices directly from your inbox without forwarding emails to external addresses. This ensures your emails remain secure and organized.
Can I use Tailride with different email clients?
Yes, Tailride is compatible with all major email clients, including Gmail, Outlook, and any service that supports IMAP. This flexibility makes it accessible for a wide range of users.
What types of documents can Tailride process?
Tailride can process various types of documents, including PDFs, images, and text within emails. This comprehensive capability ensures that all invoices and receipts are captured accurately, regardless of their format.
Is there a limit to how many users can connect to Tailride?
No, Tailride allows you to link as many users as you need. This feature is particularly useful for teams and organizations, enabling seamless collaboration in managing invoices and expenses across multiple users.
Alternatives
Dividend Data Alternatives
Dividend Data is a specialized financial data service that brings over 30 years of stock market history directly into spreadsheets. It falls into the category of tools designed for fundamental and dividend investors who prioritize ease of use and deep historical analysis without complex setups. Users often explore alternatives for various reasons, including specific budget constraints, the need for different feature sets like real-time alerts or broker integrations, or a requirement to use a platform other than Google Sheets or Excel. The search for the right tool is a continuous process of matching one's evolving investment strategy with available solutions. When evaluating any alternative, consider the depth and reliability of historical data, the simplicity of integration into your current workflow, and the overall value relative to cost. The goal is to find a service that not only meets your immediate data needs but also adapts to support your long-term analytical growth and iterative refinement of your investment process.
Tailride Alternatives
Tailride is an AI-powered accounting automation platform designed to streamline the process of managing invoices and receipts. By connecting to your email inbox, it intelligently detects and extracts relevant documents, facilitating seamless data processing. This innovative tool belongs to the Business & Finance category and enhances efficiency through features like a Chrome extension for one-click extraction and customizable AI rules for automatic categorization. Users often seek alternatives to Tailride for various reasons, including pricing considerations, specific feature requirements, or compatibility with other platforms. When exploring options, it's essential to evaluate the alternative's ability to meet your unique business needs, the robustness of its automation features, and the level of integration it offers with existing tools. A thorough assessment can help ensure that the chosen solution aligns with your operational goals and enhances productivity.