Dividend Data vs Poach
Side-by-side comparison to help you choose the right product.
Dividend Data
Automate your investment research with instant stock data and 30+ years of history directly in your spreadsheets.
Last updated: March 11, 2026
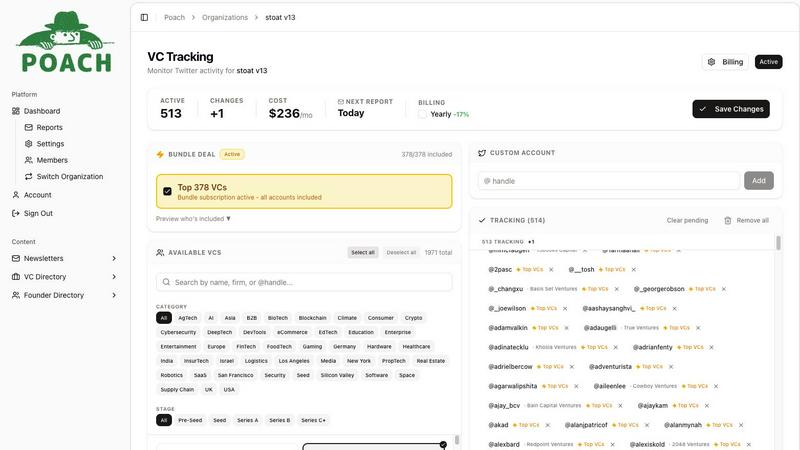
Poach
Poach helps VCs boost dealflow by tracking competitors and discovering promising founders before their seed rounds.
Last updated: February 28, 2026
Visual Comparison
Dividend Data

Poach
Feature Comparison
Dividend Data
Comprehensive Spreadsheet Integration
Dividend Data seamlessly integrates with both Google Sheets and Microsoft Excel through dedicated add-ins, requiring no API keys or coding knowledge. Users access data by typing intuitive custom formulas directly into their cells, which then pull live, updated information from Dividend Data's extensive databases. This feature automates the entire data collection process, transforming static spreadsheets into dynamic, always-current financial models that refresh with a simple recalculation, fostering a cycle of continuous improvement in your analysis.
Extensive Historical & Real-Time Data Library
The platform provides deep historical context with over 30 years of market data across more than 80,000 global tickers. Investors can pull not just current quotes but also decades of dividend history, financial statements, and key ratios. This vast historical depth is crucial for performing robust trend analysis, calculating long-term growth rates, and backtesting investment strategies, enabling a more informed and iterative approach to building and validating financial theses.
Curated Functions for Dividend Investors
Dividend Data offers 16 specialized custom functions tailored specifically for the needs of income and fundamental investors. Formulas like DIVIDENDDATA_DIVIDENDS for forward yield and ex-dates, DIVIDENDDATA_RATIOS for valuation metrics, and DIVIDENDDATA_METRICS for fundamental data ensure users get precisely the data points they need without sifting through irrelevant information. This curated approach streamlines the research process, allowing for faster, more focused analysis and decision-making.
AI-Powered Research & Portfolio Tools
Beyond spreadsheets, the Dividend Data Terminal web-app enhances the ecosystem with AI-powered research capabilities and automated portfolio tracking. The AI Analyst acts as a research assistant, while the portfolio tool automatically aggregates holdings, tracks dividend income, and visualizes performance. This creates a virtuous cycle where spreadsheet analysis informs portfolio decisions, and portfolio data feeds back into analytical models for ongoing optimization.
Poach
Track VCs on Twitter
Poach monitors the Twitter activity of top-tier venture capitalists to identify which founders they follow. These connections often signal early interest and investment potential in promising entrepreneurs, giving users a head start in discovering the next big thing.
LinkedIn Enrichment
The platform enhances its data by linking Twitter accounts to LinkedIn profiles through proprietary identity resolution techniques. This enrichment process provides users with comprehensive work history and educational background information, allowing for more informed investment decisions.
AI-Powered Labeling
Poach utilizes advanced AI algorithms to analyze data from Twitter and LinkedIn, labeling individuals based on their roles such as founders, engineers, or investors. This intelligent categorization helps users quickly identify relevant talent based on their investment thesis.
Raw Data Delivery
Users can receive raw data exports in CSV format or access data through an API. This flexibility allows for customizable filtering, enabling users to find unfunded founders or any specific criteria they are interested in exploring.
Use Cases
Dividend Data
Building Dynamic Dividend Screens
Investors can construct powerful, custom stock screens directly in their spreadsheet. By combining functions for dividend yield, payout ratio, consecutive years of growth, and PE ratio, users can create a live filter that updates automatically as market data changes. This allows for the continuous monitoring of investment criteria and the iterative refinement of a watchlist based on the most current financial metrics available.
Creating Automated Financial Models
Analysts and individual investors can build detailed discounted cash flow (DCF) or dividend discount models (DDM) that pull live data for revenue, EPS, and dividend forecasts directly into their assumptions. This automates the input stage, letting modelers focus on analysis and scenario planning. The model becomes a living document that improves in accuracy and relevance with each data refresh.
Maintaining a Live Portfolio Dashboard
Users can link their portfolio holdings in a spreadsheet to pull real-time prices, dividend announcements, and yield-on-cost calculations. This creates an automated dashboard that tracks total value, income projections, and sector allocation without manual updates. It enables a cycle of continuous portfolio review and rebalancing based on live, aggregated data.
Conducting Historical Comparative Analysis
With access to 30+ years of data, investors can perform deep historical studies, such as analyzing a company's dividend consistency through different economic cycles or comparing the historical volatility and performance of multiple assets. This long-term perspective supports more resilient, iteratively-tested investment strategies grounded in comprehensive historical evidence.
Poach
Early Founder Identification
Investors can use Poach to identify founders who have not yet raised their seed rounds, allowing them to engage with promising startups before they enter the crowded fundraising market.
Trend Analysis
Venture capitalists can track emerging trends and sectors by analyzing which founders are gaining traction on social media platforms, helping them align their investment strategies with market shifts.
Enhanced Networking
By receiving daily enriched data and insights, users can proactively connect with founders and other investors, fostering relationships that could lead to future collaborations and investment opportunities.
Targeted Investment Strategies
Poach allows users to filter and categorize potential investments based on specific criteria, such as funding status or industry focus, making it easier to align their portfolios with their investment goals.
Overview
About Dividend Data
Dividend Data is a powerful financial data platform designed to empower fundamental and dividend investors with institutional-grade market intelligence directly within their existing workflow. At its core, it eliminates the tedious, error-prone process of manually copying and pasting data by bringing over 30 years of historical stock market data for more than 80,000 tickers straight into Google Sheets and Microsoft Excel. The platform operates on a simple, code-free principle: just type a custom formula like =DIVIDENDDATA_DIVIDENDS("MSFT"), and live data instantly populates your cell. Built by a dividend investor for dividend investors, it provides instant, structured access to critical metrics including dividends, yields, payout ratios, growth rates, complete financial statements, earnings, valuation ratios, and price history through a suite of over 100 metrics. This continuous, iterative flow of data into your spreadsheets allows for dynamic, living models that improve with every refresh, ensuring your investment analysis is always based on the latest information. With a generous free tier offering 2,500 monthly credits and no trial expiration, Dividend Data makes professional-grade analysis accessible to every investor, bridging the gap between sophisticated data needs and a user-friendly, affordable price point.
About Poach
Poach is an innovative platform that empowers venture capitalists and investors to stay ahead of the curve by tracking emerging founders on social media, particularly Twitter, before they embark on fundraising campaigns. By leveraging advanced identity resolution techniques, Poach effectively uncovers promising entrepreneurs at an early stage, providing VCs with high-quality signals that exist between warm introductions and cold inbound inquiries. This proactive approach significantly expands deal flow, allowing investors to tap into a talent pool that is often overlooked until they enter the fundraising stage. Designed specifically for venture capital firms, angel investors, and those aiming to stay abreast of market trends, Poach offers daily enriched data and insights. This feature makes it an invaluable tool for individuals committed to nurturing and investing in the future of innovation. With Poach, users can discover the next wave of startup talent and make informed investment decisions based on real-time data.
Frequently Asked Questions
Dividend Data FAQ
How does the free tier work?
The free tier provides 2,500 credits per month, which do not expire and renew each month. No credit card is required to start. Each data point retrieved by a formula (e.g., one cell with a dividend yield) typically consumes one credit. This generous allowance allows for substantial usage for personal portfolio tracking and analysis, enabling users to experience and iteratively integrate the tool into their workflow at no cost.
What data can I access with the spreadsheet functions?
You can access over 100 key metrics including forward and historical dividends, ex-dividend dates, dividend yields, payout ratios, stock prices, PE ratios, EPS, full financial statement items (income statement, balance sheet, cash flow), and various other growth and valuation metrics. The 16 custom functions are designed to categorize this data intuitively for fundamental and dividend analysis.
Do I need to know how to code to use Dividend Data?
Absolutely not. Dividend Data is built specifically to require zero coding. You use it just like any native spreadsheet function (e.g., =SUM()). Simply type =DIVIDENDDATA_ and follow the formula syntax to pull data directly into your cell. The integration handles all the complex data fetching in the background, making professional analysis accessible through an interface you already know.
Does it work in both Google Sheets and Microsoft Excel?
Yes, Dividend Data offers fully functional add-ins for both Google Sheets (via the Google Workspace Marketplace) and Microsoft Excel (via Microsoft AppSource). The core experience and formula syntax are consistent across both platforms, allowing you to choose your preferred environment or even use both interchangeably while maintaining a continuous, iterative analysis process.
Poach FAQ
How does Poach identify promising founders?
Poach identifies promising founders by monitoring Twitter activity and analyzing the connections made by top-tier VCs. This helps in spotting early interest in entrepreneurs before they begin fundraising.
Can I customize the data I receive from Poach?
Yes, users can filter data based on various criteria through CSV exports or API access, allowing for tailored insights that align with individual investment strategies and goals.
What types of roles does Poach categorize?
Poach categorizes individuals into various roles such as founders, engineers, investors, researchers, and more. This helps users quickly find the talent they are interested in based on specific investment focuses.
How often does Poach provide updated information?
Poach ensures that users receive enriched data daily via email, providing them with executive summaries and comprehensive CSV exports to keep them informed about the latest entrepreneurial developments.
Alternatives
Dividend Data Alternatives
Dividend Data is a specialized financial data service that brings over 30 years of stock market history directly into spreadsheets. It falls into the category of tools designed for fundamental and dividend investors who prioritize ease of use and deep historical analysis without complex setups. Users often explore alternatives for various reasons, including specific budget constraints, the need for different feature sets like real-time alerts or broker integrations, or a requirement to use a platform other than Google Sheets or Excel. The search for the right tool is a continuous process of matching one's evolving investment strategy with available solutions. When evaluating any alternative, consider the depth and reliability of historical data, the simplicity of integration into your current workflow, and the overall value relative to cost. The goal is to find a service that not only meets your immediate data needs but also adapts to support your long-term analytical growth and iterative refinement of your investment process.
Poach Alternatives
Poach is an innovative platform that falls within the business and finance category, specifically designed to empower venture capitalists and investors by enhancing their deal flow through tracking emerging founders. Users often seek alternatives to Poach due to various reasons, such as pricing, specific feature sets, or the need for compatibility with other platforms. When selecting an alternative, it is essential to consider factors like data accuracy, user interface, integration capabilities, and the overall ability to provide actionable insights that can support investment decisions. Finding the right alternative can significantly impact how effectively investors discover and engage with promising entrepreneurs. As the landscape of startup funding evolves, priority should be given to platforms that offer comprehensive tracking features, robust analytics, and an intuitive user experience. Understanding these elements will help users make informed choices that align with their investment strategies and objectives.