Dividend Data vs Portfolio Genius
Side-by-side comparison to help you choose the right product.
Dividend Data
Automate your investment research with instant stock data and 30+ years of history directly in your spreadsheets.
Last updated: March 11, 2026
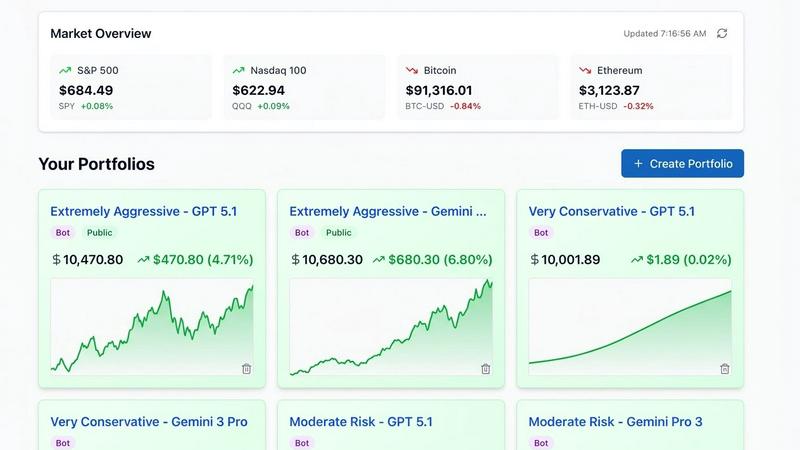
Portfolio Genius
Portfolio Genius is your AI-driven investment advisor that continuously analyzes markets for smart, tailored trading.
Last updated: March 1, 2026
Visual Comparison
Dividend Data

Portfolio Genius
Feature Comparison
Dividend Data
Comprehensive Spreadsheet Integration
Dividend Data seamlessly integrates with both Google Sheets and Microsoft Excel through dedicated add-ins, requiring no API keys or coding knowledge. Users access data by typing intuitive custom formulas directly into their cells, which then pull live, updated information from Dividend Data's extensive databases. This feature automates the entire data collection process, transforming static spreadsheets into dynamic, always-current financial models that refresh with a simple recalculation, fostering a cycle of continuous improvement in your analysis.
Extensive Historical & Real-Time Data Library
The platform provides deep historical context with over 30 years of market data across more than 80,000 global tickers. Investors can pull not just current quotes but also decades of dividend history, financial statements, and key ratios. This vast historical depth is crucial for performing robust trend analysis, calculating long-term growth rates, and backtesting investment strategies, enabling a more informed and iterative approach to building and validating financial theses.
Curated Functions for Dividend Investors
Dividend Data offers 16 specialized custom functions tailored specifically for the needs of income and fundamental investors. Formulas like DIVIDENDDATA_DIVIDENDS for forward yield and ex-dates, DIVIDENDDATA_RATIOS for valuation metrics, and DIVIDENDDATA_METRICS for fundamental data ensure users get precisely the data points they need without sifting through irrelevant information. This curated approach streamlines the research process, allowing for faster, more focused analysis and decision-making.
AI-Powered Research & Portfolio Tools
Beyond spreadsheets, the Dividend Data Terminal web-app enhances the ecosystem with AI-powered research capabilities and automated portfolio tracking. The AI Analyst acts as a research assistant, while the portfolio tool automatically aggregates holdings, tracks dividend income, and visualizes performance. This creates a virtuous cycle where spreadsheet analysis informs portfolio decisions, and portfolio data feeds back into analytical models for ongoing optimization.
Portfolio Genius
Smart AI Portfolio Tracker
The Smart AI Portfolio Tracker continuously analyzes your investment holdings, providing real-time analytics and insights. This feature ensures that users have access to the most up-to-date information, enabling them to make informed decisions based on market conditions and personal investment goals.
Intelligent Trade Management
Effortlessly log and track your trades with the Intelligent Trade Management feature. This offering provides detailed insights into your trading patterns and win rates, allowing users to understand their performance better and refine their strategies over time.
Comprehensive Portfolio Analytics
Portfolio Genius offers comprehensive portfolio analytics that deliver data-driven insights tailored to your risk profile and market conditions. This feature helps users identify strengths and weaknesses in their portfolios, allowing for adjustments that can enhance overall performance.
Leaderboard Comparisons
With Portfolio Leaderboards, users can watch AI-managed portfolios compete in real-time. This feature lets investors compare different strategies and see which approaches yield the best results, providing inspiration and insight into potential investment paths.
Use Cases
Dividend Data
Building Dynamic Dividend Screens
Investors can construct powerful, custom stock screens directly in their spreadsheet. By combining functions for dividend yield, payout ratio, consecutive years of growth, and PE ratio, users can create a live filter that updates automatically as market data changes. This allows for the continuous monitoring of investment criteria and the iterative refinement of a watchlist based on the most current financial metrics available.
Creating Automated Financial Models
Analysts and individual investors can build detailed discounted cash flow (DCF) or dividend discount models (DDM) that pull live data for revenue, EPS, and dividend forecasts directly into their assumptions. This automates the input stage, letting modelers focus on analysis and scenario planning. The model becomes a living document that improves in accuracy and relevance with each data refresh.
Maintaining a Live Portfolio Dashboard
Users can link their portfolio holdings in a spreadsheet to pull real-time prices, dividend announcements, and yield-on-cost calculations. This creates an automated dashboard that tracks total value, income projections, and sector allocation without manual updates. It enables a cycle of continuous portfolio review and rebalancing based on live, aggregated data.
Conducting Historical Comparative Analysis
With access to 30+ years of data, investors can perform deep historical studies, such as analyzing a company's dividend consistency through different economic cycles or comparing the historical volatility and performance of multiple assets. This long-term perspective supports more resilient, iteratively-tested investment strategies grounded in comprehensive historical evidence.
Portfolio Genius
For Busy Professionals
Busy professionals can leverage Portfolio Genius to manage their investments efficiently without having to spend excessive time analyzing data. The AI-powered insights help them make timely decisions, ensuring their portfolios align with their financial goals.
For Novice Investors
Novice investors can benefit significantly from Portfolio Genius by using its user-friendly interface and educational resources. This tool simplifies complex investment concepts, allowing beginners to build and manage their portfolios confidently.
For Seasoned Traders
Seasoned traders can utilize Portfolio Genius to enhance their trading strategies with data-driven insights. The platform's real-time analytics provide experienced investors with a competitive edge, enabling them to capitalize on market fluctuations effectively.
For Financial Advisors
Financial advisors can use Portfolio Genius as a powerful tool to provide enhanced services to their clients. By integrating the platform's analytics and insights, advisors can deliver personalized recommendations that align with their clients' unique investment objectives.
Overview
About Dividend Data
Dividend Data is a powerful financial data platform designed to empower fundamental and dividend investors with institutional-grade market intelligence directly within their existing workflow. At its core, it eliminates the tedious, error-prone process of manually copying and pasting data by bringing over 30 years of historical stock market data for more than 80,000 tickers straight into Google Sheets and Microsoft Excel. The platform operates on a simple, code-free principle: just type a custom formula like =DIVIDENDDATA_DIVIDENDS("MSFT"), and live data instantly populates your cell. Built by a dividend investor for dividend investors, it provides instant, structured access to critical metrics including dividends, yields, payout ratios, growth rates, complete financial statements, earnings, valuation ratios, and price history through a suite of over 100 metrics. This continuous, iterative flow of data into your spreadsheets allows for dynamic, living models that improve with every refresh, ensuring your investment analysis is always based on the latest information. With a generous free tier offering 2,500 monthly credits and no trial expiration, Dividend Data makes professional-grade analysis accessible to every investor, bridging the gap between sophisticated data needs and a user-friendly, affordable price point.
About Portfolio Genius
Portfolio Genius is an advanced AI-powered investment advisor that transforms the way individual investors manage their portfolios. By harnessing the power of cutting-edge artificial intelligence, it provides intelligent recommendations based on real-time market analysis, news trends, and specific portfolio holdings. This innovative tool is designed for a wide range of users, including busy professionals, novice investors, and seasoned traders, all seeking data-driven insights to refine and optimize their investment strategies. The main value proposition of Portfolio Genius lies in its ability to automate portfolio management while maintaining a user-friendly conversational interface. This allows users to engage easily with their AI advisor, making informed decisions grounded in comprehensive analytics and personalized recommendations. With robust features such as performance tracking, multiple portfolio management, and seamless strategy adjustments, Portfolio Genius empowers investors to take control of their financial futures with confidence and clarity.
Frequently Asked Questions
Dividend Data FAQ
How does the free tier work?
The free tier provides 2,500 credits per month, which do not expire and renew each month. No credit card is required to start. Each data point retrieved by a formula (e.g., one cell with a dividend yield) typically consumes one credit. This generous allowance allows for substantial usage for personal portfolio tracking and analysis, enabling users to experience and iteratively integrate the tool into their workflow at no cost.
What data can I access with the spreadsheet functions?
You can access over 100 key metrics including forward and historical dividends, ex-dividend dates, dividend yields, payout ratios, stock prices, PE ratios, EPS, full financial statement items (income statement, balance sheet, cash flow), and various other growth and valuation metrics. The 16 custom functions are designed to categorize this data intuitively for fundamental and dividend analysis.
Do I need to know how to code to use Dividend Data?
Absolutely not. Dividend Data is built specifically to require zero coding. You use it just like any native spreadsheet function (e.g., =SUM()). Simply type =DIVIDENDDATA_ and follow the formula syntax to pull data directly into your cell. The integration handles all the complex data fetching in the background, making professional analysis accessible through an interface you already know.
Does it work in both Google Sheets and Microsoft Excel?
Yes, Dividend Data offers fully functional add-ins for both Google Sheets (via the Google Workspace Marketplace) and Microsoft Excel (via Microsoft AppSource). The core experience and formula syntax are consistent across both platforms, allowing you to choose your preferred environment or even use both interchangeably while maintaining a continuous, iterative analysis process.
Portfolio Genius FAQ
Does Portfolio Genius provide investment advice?
No, Portfolio Genius does not provide personalized investment advice. It serves as a portfolio tracking and analytics platform designed to offer educational and informational analysis based on data.
How secure is my data with Portfolio Genius?
Portfolio Genius employs bank-grade security measures to ensure that your data is encrypted and protected. Enterprise-level security standards are implemented to safeguard your information.
Can I track multiple portfolios with Portfolio Genius?
Yes, Portfolio Genius allows users to manage multiple portfolios seamlessly. This feature enables investors to diversify their investments and monitor performance across different asset classes and strategies.
Is there a free trial available for Portfolio Genius?
Yes, Portfolio Genius offers a 7-day free trial for new users. This allows you to explore the platform's features and capabilities without any commitment before choosing a subscription plan.
Alternatives
Dividend Data Alternatives
Dividend Data is a specialized financial data service that brings over 30 years of stock market history directly into spreadsheets. It falls into the category of tools designed for fundamental and dividend investors who prioritize ease of use and deep historical analysis without complex setups. Users often explore alternatives for various reasons, including specific budget constraints, the need for different feature sets like real-time alerts or broker integrations, or a requirement to use a platform other than Google Sheets or Excel. The search for the right tool is a continuous process of matching one's evolving investment strategy with available solutions. When evaluating any alternative, consider the depth and reliability of historical data, the simplicity of integration into your current workflow, and the overall value relative to cost. The goal is to find a service that not only meets your immediate data needs but also adapts to support your long-term analytical growth and iterative refinement of your investment process.
Portfolio Genius Alternatives
Portfolio Genius is an AI-driven investment advisor that helps individual investors manage their portfolios more effectively. Utilizing advanced artificial intelligence, it analyzes market conditions and personal investment portfolios to generate intelligent recommendations. This innovative tool is part of the business and finance category, catering to a wide range of users, from busy professionals to seasoned traders. Users often seek alternatives to Portfolio Genius for various reasons, including pricing, feature sets, or specific platform needs that align more closely with their investment strategies. When searching for an alternative, it's essential to consider factors like user interface, flexibility in trading options, customization capabilities, and the overall reliability of the investment insights provided. Ensuring that the alternative meets your specific investment goals and preferences will enhance your trading experience.