Dividend Data vs GrowPanel
Side-by-side comparison to help you choose the right product.
Dividend Data
Automate your investment research with instant stock data and 30+ years of history directly in your spreadsheets.
Last updated: March 11, 2026
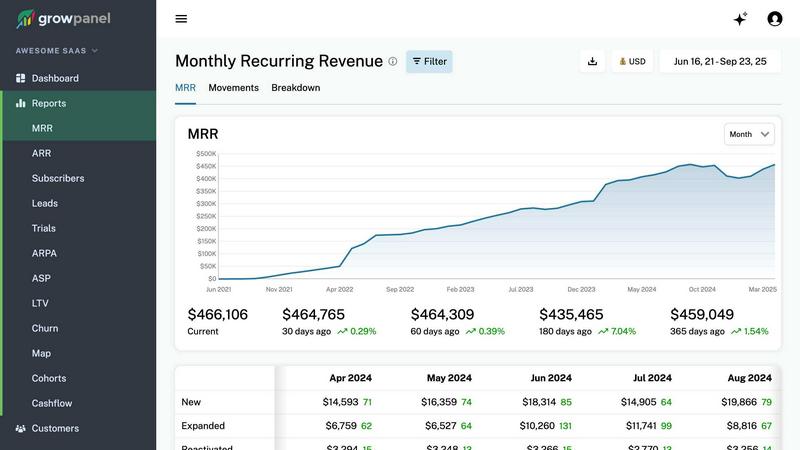
GrowPanel
GrowPanel delivers real-time MRR, churn, and LTV insights for SaaS, helping you make smarter business decisions.
Last updated: February 26, 2026
Visual Comparison
Dividend Data

GrowPanel
Feature Comparison
Dividend Data
Comprehensive Spreadsheet Integration
Dividend Data seamlessly integrates with both Google Sheets and Microsoft Excel through dedicated add-ins, requiring no API keys or coding knowledge. Users access data by typing intuitive custom formulas directly into their cells, which then pull live, updated information from Dividend Data's extensive databases. This feature automates the entire data collection process, transforming static spreadsheets into dynamic, always-current financial models that refresh with a simple recalculation, fostering a cycle of continuous improvement in your analysis.
Extensive Historical & Real-Time Data Library
The platform provides deep historical context with over 30 years of market data across more than 80,000 global tickers. Investors can pull not just current quotes but also decades of dividend history, financial statements, and key ratios. This vast historical depth is crucial for performing robust trend analysis, calculating long-term growth rates, and backtesting investment strategies, enabling a more informed and iterative approach to building and validating financial theses.
Curated Functions for Dividend Investors
Dividend Data offers 16 specialized custom functions tailored specifically for the needs of income and fundamental investors. Formulas like DIVIDENDDATA_DIVIDENDS for forward yield and ex-dates, DIVIDENDDATA_RATIOS for valuation metrics, and DIVIDENDDATA_METRICS for fundamental data ensure users get precisely the data points they need without sifting through irrelevant information. This curated approach streamlines the research process, allowing for faster, more focused analysis and decision-making.
AI-Powered Research & Portfolio Tools
Beyond spreadsheets, the Dividend Data Terminal web-app enhances the ecosystem with AI-powered research capabilities and automated portfolio tracking. The AI Analyst acts as a research assistant, while the portfolio tool automatically aggregates holdings, tracks dividend income, and visualizes performance. This creates a virtuous cycle where spreadsheet analysis informs portfolio decisions, and portfolio data feeds back into analytical models for ongoing optimization.
GrowPanel
Real-time MRR, ARR, churn, and LTV tracking
GrowPanel offers instant tracking of key revenue metrics, including MRR, ARR, churn rates, and Customer Lifetime Value (LTV). This feature allows businesses to monitor their financial performance in real-time, enabling quick and informed decision-making.
Trial conversion and cohort analysis
With GrowPanel, you can analyze how trial users behave and identify conversion patterns. This feature enhances your understanding of customer journeys, allowing you to convert more trial users into paying customers effectively.
Revenue segmentation by plan, country, currency, or custom attributes
This feature allows for detailed revenue segmentation, enabling businesses to filter and analyze data based on specific attributes such as subscription plan, geographical location, or currency. This granular analysis helps identify trends and growth opportunities.
AI chat to query your metrics in plain language
GrowPanel's AI chat feature allows users to interact with their data conversationally. You can ask questions in plain language, such as "What's our churn rate in Europe this quarter?" providing instant answers and insights without navigating complex dashboards.
Use Cases
Dividend Data
Building Dynamic Dividend Screens
Investors can construct powerful, custom stock screens directly in their spreadsheet. By combining functions for dividend yield, payout ratio, consecutive years of growth, and PE ratio, users can create a live filter that updates automatically as market data changes. This allows for the continuous monitoring of investment criteria and the iterative refinement of a watchlist based on the most current financial metrics available.
Creating Automated Financial Models
Analysts and individual investors can build detailed discounted cash flow (DCF) or dividend discount models (DDM) that pull live data for revenue, EPS, and dividend forecasts directly into their assumptions. This automates the input stage, letting modelers focus on analysis and scenario planning. The model becomes a living document that improves in accuracy and relevance with each data refresh.
Maintaining a Live Portfolio Dashboard
Users can link their portfolio holdings in a spreadsheet to pull real-time prices, dividend announcements, and yield-on-cost calculations. This creates an automated dashboard that tracks total value, income projections, and sector allocation without manual updates. It enables a cycle of continuous portfolio review and rebalancing based on live, aggregated data.
Conducting Historical Comparative Analysis
With access to 30+ years of data, investors can perform deep historical studies, such as analyzing a company's dividend consistency through different economic cycles or comparing the historical volatility and performance of multiple assets. This long-term perspective supports more resilient, iteratively-tested investment strategies grounded in comprehensive historical evidence.
GrowPanel
Monitoring financial health
SaaS companies can utilize GrowPanel to keep a close eye on their financial health by tracking essential metrics like MRR and ARR in real-time. This continuous oversight aids in making strategic decisions based on current performance.
Enhancing trial conversions
Marketing teams can leverage GrowPanel's trial conversion insights to identify effective strategies for turning free trial users into paying customers. This data-driven approach boosts conversion rates and strengthens customer acquisition efforts.
Analyzing customer retention
Customer success teams can utilize GrowPanel's cohort analysis to understand retention patterns over time. By visualizing churn reasons and tracking customer lifetime, teams can develop targeted strategies to improve retention rates.
Streamlining cash flow management
Finance departments can use GrowPanel's cash flow reporting to gain clarity on all revenue sources, refunds, taxes, and fees. This comprehensive overview facilitates better cash flow management and helps in anticipating financial challenges.
Overview
About Dividend Data
Dividend Data is a powerful financial data platform designed to empower fundamental and dividend investors with institutional-grade market intelligence directly within their existing workflow. At its core, it eliminates the tedious, error-prone process of manually copying and pasting data by bringing over 30 years of historical stock market data for more than 80,000 tickers straight into Google Sheets and Microsoft Excel. The platform operates on a simple, code-free principle: just type a custom formula like =DIVIDENDDATA_DIVIDENDS("MSFT"), and live data instantly populates your cell. Built by a dividend investor for dividend investors, it provides instant, structured access to critical metrics including dividends, yields, payout ratios, growth rates, complete financial statements, earnings, valuation ratios, and price history through a suite of over 100 metrics. This continuous, iterative flow of data into your spreadsheets allows for dynamic, living models that improve with every refresh, ensuring your investment analysis is always based on the latest information. With a generous free tier offering 2,500 monthly credits and no trial expiration, Dividend Data makes professional-grade analysis accessible to every investor, bridging the gap between sophisticated data needs and a user-friendly, affordable price point.
About GrowPanel
GrowPanel is a cutting-edge subscription analytics platform meticulously designed for Software as a Service (SaaS) companies. It aims to alleviate the complexities of tracking revenue metrics that often lead to spreadsheet chaos. By connecting your billing platform—such as Stripe, Chargebee, or Recurly—with just a single click, GrowPanel offers beautiful, real-time dashboards that display critical metrics like Monthly Recurring Revenue (MRR), Annual Recurring Revenue (ARR), churn rates, retention rates, expansion revenue, and detailed cohort analysis. This tool empowers SaaS businesses by providing instant clarity on their financial health, enabling teams to make informed decisions that drive growth. With its intuitive interface and mobile-friendly design, GrowPanel is ideal for startups and established businesses alike, allowing for seamless monitoring of performance metrics and fostering an environment of continuous improvement.
Frequently Asked Questions
Dividend Data FAQ
How does the free tier work?
The free tier provides 2,500 credits per month, which do not expire and renew each month. No credit card is required to start. Each data point retrieved by a formula (e.g., one cell with a dividend yield) typically consumes one credit. This generous allowance allows for substantial usage for personal portfolio tracking and analysis, enabling users to experience and iteratively integrate the tool into their workflow at no cost.
What data can I access with the spreadsheet functions?
You can access over 100 key metrics including forward and historical dividends, ex-dividend dates, dividend yields, payout ratios, stock prices, PE ratios, EPS, full financial statement items (income statement, balance sheet, cash flow), and various other growth and valuation metrics. The 16 custom functions are designed to categorize this data intuitively for fundamental and dividend analysis.
Do I need to know how to code to use Dividend Data?
Absolutely not. Dividend Data is built specifically to require zero coding. You use it just like any native spreadsheet function (e.g., =SUM()). Simply type =DIVIDENDDATA_ and follow the formula syntax to pull data directly into your cell. The integration handles all the complex data fetching in the background, making professional analysis accessible through an interface you already know.
Does it work in both Google Sheets and Microsoft Excel?
Yes, Dividend Data offers fully functional add-ins for both Google Sheets (via the Google Workspace Marketplace) and Microsoft Excel (via Microsoft AppSource). The core experience and formula syntax are consistent across both platforms, allowing you to choose your preferred environment or even use both interchangeably while maintaining a continuous, iterative analysis process.
GrowPanel FAQ
What types of billing platforms can I connect to GrowPanel?
You can connect various billing platforms to GrowPanel, including Stripe, Chargebee, Recurly, or any other billing source. The integration process is straightforward and requires just one click.
Is GrowPanel GDPR compliant?
Yes, GrowPanel is hosted in the EU and complies with GDPR regulations. This ensures that your data is handled with the highest standards of privacy and security.
How does the AI chat feature work?
The AI chat feature allows you to query your metrics in plain language. You can ask simple questions about your subscription data, and the AI will provide instant answers, making data exploration more intuitive.
What kind of reports can I generate with GrowPanel?
GrowPanel enables you to generate a variety of reports, including cash flow reports, cohort analysis, and revenue segmentation insights. You can also schedule automated reports to stay informed effortlessly.
Alternatives
Dividend Data Alternatives
Dividend Data is a specialized financial data service that brings over 30 years of stock market history directly into spreadsheets. It falls into the category of tools designed for fundamental and dividend investors who prioritize ease of use and deep historical analysis without complex setups. Users often explore alternatives for various reasons, including specific budget constraints, the need for different feature sets like real-time alerts or broker integrations, or a requirement to use a platform other than Google Sheets or Excel. The search for the right tool is a continuous process of matching one's evolving investment strategy with available solutions. When evaluating any alternative, consider the depth and reliability of historical data, the simplicity of integration into your current workflow, and the overall value relative to cost. The goal is to find a service that not only meets your immediate data needs but also adapts to support your long-term analytical growth and iterative refinement of your investment process.
GrowPanel Alternatives
GrowPanel is a subscription analytics platform designed specifically for SaaS companies, enabling them to gain clarity on essential revenue metrics without the hassle of spreadsheets. It offers real-time insights into key performance indicators such as MRR, churn, and LTV, streamlining the analytics process by integrating seamlessly with popular billing systems like Stripe, Chargebee, or Recurly. Users often seek alternatives to GrowPanel for a variety of reasons, including pricing concerns, specific feature requirements, or the need for compatibility with different platforms. When choosing an alternative, it's essential to consider factors such as the comprehensiveness of analytics offered, ease of integration with existing systems, user experience, and whether the platform aligns with your organization's growth trajectory and compliance needs.