Dividend Data vs echoloc
Side-by-side comparison to help you choose the right product.
Dividend Data
Automate your investment research with instant stock data and 30+ years of history directly in your spreadsheets.
Last updated: March 11, 2026
Echoloc uncovers buying signals in job posts, enabling sales teams to target ready-to-buy accounts effectively.
Last updated: February 28, 2026
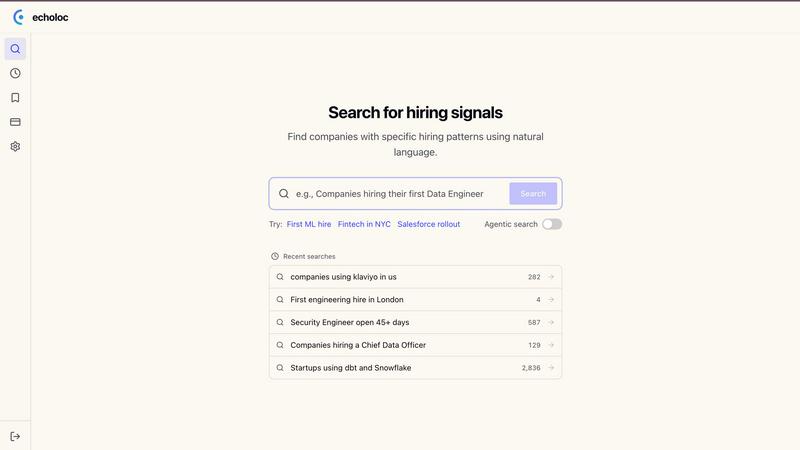
Visual Comparison
Dividend Data

echoloc
Feature Comparison
Dividend Data
Comprehensive Spreadsheet Integration
Dividend Data seamlessly integrates with both Google Sheets and Microsoft Excel through dedicated add-ins, requiring no API keys or coding knowledge. Users access data by typing intuitive custom formulas directly into their cells, which then pull live, updated information from Dividend Data's extensive databases. This feature automates the entire data collection process, transforming static spreadsheets into dynamic, always-current financial models that refresh with a simple recalculation, fostering a cycle of continuous improvement in your analysis.
Extensive Historical & Real-Time Data Library
The platform provides deep historical context with over 30 years of market data across more than 80,000 global tickers. Investors can pull not just current quotes but also decades of dividend history, financial statements, and key ratios. This vast historical depth is crucial for performing robust trend analysis, calculating long-term growth rates, and backtesting investment strategies, enabling a more informed and iterative approach to building and validating financial theses.
Curated Functions for Dividend Investors
Dividend Data offers 16 specialized custom functions tailored specifically for the needs of income and fundamental investors. Formulas like DIVIDENDDATA_DIVIDENDS for forward yield and ex-dates, DIVIDENDDATA_RATIOS for valuation metrics, and DIVIDENDDATA_METRICS for fundamental data ensure users get precisely the data points they need without sifting through irrelevant information. This curated approach streamlines the research process, allowing for faster, more focused analysis and decision-making.
AI-Powered Research & Portfolio Tools
Beyond spreadsheets, the Dividend Data Terminal web-app enhances the ecosystem with AI-powered research capabilities and automated portfolio tracking. The AI Analyst acts as a research assistant, while the portfolio tool automatically aggregates holdings, tracks dividend income, and visualizes performance. This creates a virtuous cycle where spreadsheet analysis informs portfolio decisions, and portfolio data feeds back into analytical models for ongoing optimization.
echoloc
Real-Time Job Analysis
Echoloc analyzes over 10 million job postings, allowing sales teams to identify potential buyers actively hiring. This feature provides real-time updates on hiring signals, helping teams stay ahead of market trends.
Evidence-Based Results
Every match generated by Echoloc includes job-post snippets that serve as proof of buying intent. This transparency eliminates guesswork and ensures sales professionals have reliable data to back their outreach efforts.
Customizable Search Queries
Echoloc allows users to type in search queries in plain English, making it accessible for everyone, regardless of their technical expertise. This feature simplifies the process of identifying specific hiring signals relevant to their sales strategy.
Comprehensive Company Tracking
With the ability to track over 30 million companies, Echoloc provides insights into organizational growth phases and potential technology investments. This extensive tracking capability allows sales teams to focus on high-potential targets.
Use Cases
Dividend Data
Building Dynamic Dividend Screens
Investors can construct powerful, custom stock screens directly in their spreadsheet. By combining functions for dividend yield, payout ratio, consecutive years of growth, and PE ratio, users can create a live filter that updates automatically as market data changes. This allows for the continuous monitoring of investment criteria and the iterative refinement of a watchlist based on the most current financial metrics available.
Creating Automated Financial Models
Analysts and individual investors can build detailed discounted cash flow (DCF) or dividend discount models (DDM) that pull live data for revenue, EPS, and dividend forecasts directly into their assumptions. This automates the input stage, letting modelers focus on analysis and scenario planning. The model becomes a living document that improves in accuracy and relevance with each data refresh.
Maintaining a Live Portfolio Dashboard
Users can link their portfolio holdings in a spreadsheet to pull real-time prices, dividend announcements, and yield-on-cost calculations. This creates an automated dashboard that tracks total value, income projections, and sector allocation without manual updates. It enables a cycle of continuous portfolio review and rebalancing based on live, aggregated data.
Conducting Historical Comparative Analysis
With access to 30+ years of data, investors can perform deep historical studies, such as analyzing a company's dividend consistency through different economic cycles or comparing the historical volatility and performance of multiple assets. This long-term perspective supports more resilient, iteratively-tested investment strategies grounded in comprehensive historical evidence.
echoloc
Identifying Growth Opportunities
Sales teams can leverage Echoloc to identify companies that are hiring for key positions, such as a Chief Data Officer or data engineers. This insight allows them to target organizations likely to invest in new technologies.
Proactive Outreach for New Hires
When a company posts a job for its first ML engineer, it signals a greenfield budget for AI investments. Sales teams can use this information to initiate proactive outreach, positioning their solutions as essential for the new hire's success.
Targeting Companies in Scaling Phases
Echoloc enables sales professionals to identify companies experiencing hiring spikes, such as fintech startups expanding their engineering teams. This information helps teams to engage with companies that are likely to require new software solutions during their growth.
Addressing Urgent Needs
By monitoring job postings for positions that have been open for an extended period, like a Security Engineer, sales teams can identify companies in urgent need of solutions. This allows for timely and relevant outreach to address their challenges.
Overview
About Dividend Data
Dividend Data is a powerful financial data platform designed to empower fundamental and dividend investors with institutional-grade market intelligence directly within their existing workflow. At its core, it eliminates the tedious, error-prone process of manually copying and pasting data by bringing over 30 years of historical stock market data for more than 80,000 tickers straight into Google Sheets and Microsoft Excel. The platform operates on a simple, code-free principle: just type a custom formula like =DIVIDENDDATA_DIVIDENDS("MSFT"), and live data instantly populates your cell. Built by a dividend investor for dividend investors, it provides instant, structured access to critical metrics including dividends, yields, payout ratios, growth rates, complete financial statements, earnings, valuation ratios, and price history through a suite of over 100 metrics. This continuous, iterative flow of data into your spreadsheets allows for dynamic, living models that improve with every refresh, ensuring your investment analysis is always based on the latest information. With a generous free tier offering 2,500 monthly credits and no trial expiration, Dividend Data makes professional-grade analysis accessible to every investor, bridging the gap between sophisticated data needs and a user-friendly, affordable price point.
About echoloc
Echoloc is an innovative platform tailored to revolutionize the way sales professionals identify and engage with potential buyers. By meticulously analyzing job postings, Echoloc reveals hidden buying signals that indicate when organizations are preparing to invest in new technologies or services. This distinct approach empowers sales development representatives (SDRs), account executives (AEs), and revenue teams to spot lucrative opportunities ahead of conventional intent data providers. For example, when a company announces a job opening for its first data engineer or expands its sales team, it's a clear indication of growth and forthcoming spending. With Echoloc, sales professionals can rely on concrete evidence derived from job descriptions, ensuring their outreach is both informed and timely. This capability enhances targeting precision and enables teams to stay ahead of competitors by catching buyer intent before it becomes widely recognized.
Frequently Asked Questions
Dividend Data FAQ
How does the free tier work?
The free tier provides 2,500 credits per month, which do not expire and renew each month. No credit card is required to start. Each data point retrieved by a formula (e.g., one cell with a dividend yield) typically consumes one credit. This generous allowance allows for substantial usage for personal portfolio tracking and analysis, enabling users to experience and iteratively integrate the tool into their workflow at no cost.
What data can I access with the spreadsheet functions?
You can access over 100 key metrics including forward and historical dividends, ex-dividend dates, dividend yields, payout ratios, stock prices, PE ratios, EPS, full financial statement items (income statement, balance sheet, cash flow), and various other growth and valuation metrics. The 16 custom functions are designed to categorize this data intuitively for fundamental and dividend analysis.
Do I need to know how to code to use Dividend Data?
Absolutely not. Dividend Data is built specifically to require zero coding. You use it just like any native spreadsheet function (e.g., =SUM()). Simply type =DIVIDENDDATA_ and follow the formula syntax to pull data directly into your cell. The integration handles all the complex data fetching in the background, making professional analysis accessible through an interface you already know.
Does it work in both Google Sheets and Microsoft Excel?
Yes, Dividend Data offers fully functional add-ins for both Google Sheets (via the Google Workspace Marketplace) and Microsoft Excel (via Microsoft AppSource). The core experience and formula syntax are consistent across both platforms, allowing you to choose your preferred environment or even use both interchangeably while maintaining a continuous, iterative analysis process.
echoloc FAQ
How does Echoloc identify buyer intent?
Echoloc analyzes job postings to uncover hiring signals that indicate potential investments in new technologies or services. By focusing on job descriptions, it reveals concrete evidence of buyer intent before it becomes mainstream.
Can I customize my search queries on Echoloc?
Yes, Echoloc allows users to input search queries in plain English, making it easy to find specific hiring signals without needing technical expertise. This feature enhances the user experience and accessibility.
What types of companies can I track with Echoloc?
Echoloc tracks over 30 million companies across various industries, providing insights into their hiring activities and growth phases. This extensive database enables sales teams to focus on high-potential targets.
How often does Echoloc update its job postings?
Echoloc provides real-time updates, ensuring that users have access to the most current job postings and hiring signals. This continuous monitoring helps teams stay informed and agile in their sales strategies.
Alternatives
Dividend Data Alternatives
Dividend Data is a specialized financial data service that brings over 30 years of stock market history directly into spreadsheets. It falls into the category of tools designed for fundamental and dividend investors who prioritize ease of use and deep historical analysis without complex setups. Users often explore alternatives for various reasons, including specific budget constraints, the need for different feature sets like real-time alerts or broker integrations, or a requirement to use a platform other than Google Sheets or Excel. The search for the right tool is a continuous process of matching one's evolving investment strategy with available solutions. When evaluating any alternative, consider the depth and reliability of historical data, the simplicity of integration into your current workflow, and the overall value relative to cost. The goal is to find a service that not only meets your immediate data needs but also adapts to support your long-term analytical growth and iterative refinement of your investment process.
echoloc Alternatives
Echoloc is an innovative platform designed for sales professionals, enabling them to identify potential buyers by analyzing job posts for hidden buying signals. As part of the business and finance category, Echoloc helps sales teams target accounts that are preparing to invest in new technologies or services, allowing them to engage early in the buying process. Users often seek alternatives due to various reasons, including pricing concerns, feature sets that may not align with their specific needs, or the desire for compatibility with existing platforms and workflows. When choosing an alternative, it's essential to consider factors such as the accuracy of buying signal detection, the breadth of data analysis, user interface design, and overall integration capabilities. A thorough understanding of your team's unique requirements will help in selecting a solution that not only meets current needs but also adapts to future demands, ensuring a robust sales strategy.