Banknaked vs Dividend Data
Side-by-side comparison to help you choose the right product.

Banknaked
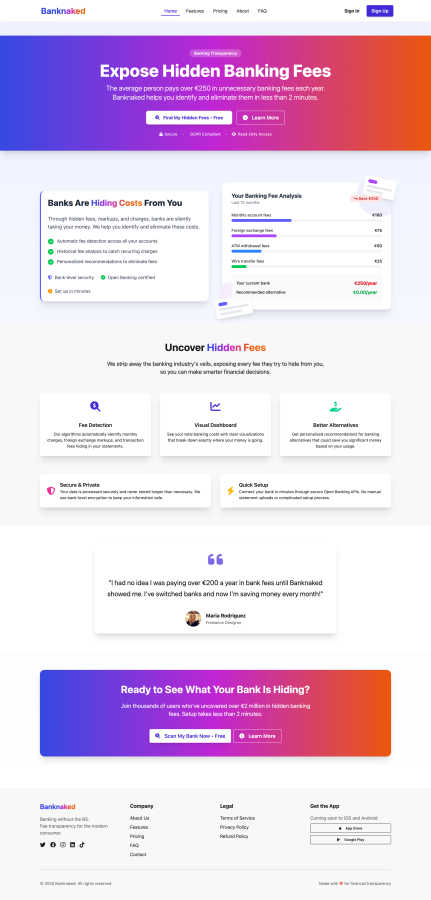
Banknaked uncovers hidden banking fees in minutes, empowering you to save money with personalized recommendations.
Last updated: March 1, 2026
Dividend Data
Automate your investment research with instant stock data and 30+ years of history directly in your spreadsheets.
Last updated: March 11, 2026
Visual Comparison
Banknaked
Dividend Data

Feature Comparison
Banknaked
Automatic Fee Detection
Banknaked's algorithms are designed to automatically identify and highlight hidden fees across all your banking accounts. This feature helps users discover recurring charges, foreign exchange markups, and transaction fees that may otherwise go unnoticed. By streamlining the fee detection process, Banknaked ensures users can address potential savings quickly and efficiently.
Visual Dashboard
The platform features a visually engaging dashboard that provides a clear overview of your total banking costs. With intuitive visualizations, users can easily understand where their money is going each month, enabling them to make informed financial decisions based on real data rather than assumptions.
Historical Fee Analysis
Banknaked offers a historical analysis of fees to help users catch recurring charges over time. By reviewing past transactions and fees, individuals can identify patterns and trends in their banking costs, allowing for more strategic financial management and proactive decision-making.
Personalized Recommendations
Users receive tailored recommendations on better banking alternatives based on their unique usage patterns. This feature not only highlights potential savings but also guides users towards more cost-effective banking solutions that align with their financial needs and goals.
Dividend Data
Comprehensive Spreadsheet Integration
Dividend Data seamlessly integrates with both Google Sheets and Microsoft Excel through dedicated add-ins, requiring no API keys or coding knowledge. Users access data by typing intuitive custom formulas directly into their cells, which then pull live, updated information from Dividend Data's extensive databases. This feature automates the entire data collection process, transforming static spreadsheets into dynamic, always-current financial models that refresh with a simple recalculation, fostering a cycle of continuous improvement in your analysis.
Extensive Historical & Real-Time Data Library
The platform provides deep historical context with over 30 years of market data across more than 80,000 global tickers. Investors can pull not just current quotes but also decades of dividend history, financial statements, and key ratios. This vast historical depth is crucial for performing robust trend analysis, calculating long-term growth rates, and backtesting investment strategies, enabling a more informed and iterative approach to building and validating financial theses.
Curated Functions for Dividend Investors
Dividend Data offers 16 specialized custom functions tailored specifically for the needs of income and fundamental investors. Formulas like DIVIDENDDATA_DIVIDENDS for forward yield and ex-dates, DIVIDENDDATA_RATIOS for valuation metrics, and DIVIDENDDATA_METRICS for fundamental data ensure users get precisely the data points they need without sifting through irrelevant information. This curated approach streamlines the research process, allowing for faster, more focused analysis and decision-making.
AI-Powered Research & Portfolio Tools
Beyond spreadsheets, the Dividend Data Terminal web-app enhances the ecosystem with AI-powered research capabilities and automated portfolio tracking. The AI Analyst acts as a research assistant, while the portfolio tool automatically aggregates holdings, tracks dividend income, and visualizes performance. This creates a virtuous cycle where spreadsheet analysis informs portfolio decisions, and portfolio data feeds back into analytical models for ongoing optimization.
Use Cases
Banknaked
Identifying Hidden Fees
With Banknaked, users can swiftly uncover hidden fees that their banks may not readily disclose. By scanning through transaction histories, individuals can pinpoint unnecessary charges they can eliminate, resulting in immediate savings.
Evaluating Banking Alternatives
The tool empowers users to compare their current bank with recommended alternatives. By analyzing fees and features, users can make well-informed decisions about switching banks, ensuring they choose the most advantageous options available.
Managing Monthly Expenses
Banknaked aids users in managing their monthly banking expenses effectively. With clear visualizations of monthly charges, individuals can set budgets, track spending, and identify areas where they can cut costs, fostering better financial habits.
Negotiating Banking Fees
Armed with detailed insights from Banknaked, users can confidently approach their bank to negotiate fees. By presenting data-driven arguments, individuals can advocate for better terms and potentially lower their banking costs significantly.
Dividend Data
Building Dynamic Dividend Screens
Investors can construct powerful, custom stock screens directly in their spreadsheet. By combining functions for dividend yield, payout ratio, consecutive years of growth, and PE ratio, users can create a live filter that updates automatically as market data changes. This allows for the continuous monitoring of investment criteria and the iterative refinement of a watchlist based on the most current financial metrics available.
Creating Automated Financial Models
Analysts and individual investors can build detailed discounted cash flow (DCF) or dividend discount models (DDM) that pull live data for revenue, EPS, and dividend forecasts directly into their assumptions. This automates the input stage, letting modelers focus on analysis and scenario planning. The model becomes a living document that improves in accuracy and relevance with each data refresh.
Maintaining a Live Portfolio Dashboard
Users can link their portfolio holdings in a spreadsheet to pull real-time prices, dividend announcements, and yield-on-cost calculations. This creates an automated dashboard that tracks total value, income projections, and sector allocation without manual updates. It enables a cycle of continuous portfolio review and rebalancing based on live, aggregated data.
Conducting Historical Comparative Analysis
With access to 30+ years of data, investors can perform deep historical studies, such as analyzing a company's dividend consistency through different economic cycles or comparing the historical volatility and performance of multiple assets. This long-term perspective supports more resilient, iteratively-tested investment strategies grounded in comprehensive historical evidence.
Overview
About Banknaked
Banknaked is a groundbreaking financial transparency tool that empowers consumers to uncover hidden banking fees that often go unnoticed. By leveraging the innovative capabilities of Open Banking, Banknaked securely connects to users' bank accounts to deliver a detailed analysis of their monthly charges, transaction fees, and ambiguous costs that banks typically do not communicate clearly. Designed for individuals who aspire to gain control over their financial well-being, Banknaked allows users to quickly identify unnecessary expenses, with the potential to save over €250 annually on banking fees alone. With a strong commitment to user privacy, Banknaked ensures read-only access, thus safeguarding users' security and data integrity. With its user-friendly explanations and visual representations, Banknaked equips users to make informed decisions about switching banks, negotiating fees, or eliminating unneeded services. Start your journey for free and explore deeper insights into your banking habits, as your financial well-being deserves complete transparency.
About Dividend Data
Dividend Data is a powerful financial data platform designed to empower fundamental and dividend investors with institutional-grade market intelligence directly within their existing workflow. At its core, it eliminates the tedious, error-prone process of manually copying and pasting data by bringing over 30 years of historical stock market data for more than 80,000 tickers straight into Google Sheets and Microsoft Excel. The platform operates on a simple, code-free principle: just type a custom formula like =DIVIDENDDATA_DIVIDENDS("MSFT"), and live data instantly populates your cell. Built by a dividend investor for dividend investors, it provides instant, structured access to critical metrics including dividends, yields, payout ratios, growth rates, complete financial statements, earnings, valuation ratios, and price history through a suite of over 100 metrics. This continuous, iterative flow of data into your spreadsheets allows for dynamic, living models that improve with every refresh, ensuring your investment analysis is always based on the latest information. With a generous free tier offering 2,500 monthly credits and no trial expiration, Dividend Data makes professional-grade analysis accessible to every investor, bridging the gap between sophisticated data needs and a user-friendly, affordable price point.
Frequently Asked Questions
Banknaked FAQ
How does Banknaked ensure my data is secure?
Banknaked prioritizes user privacy and security by utilizing bank-level encryption and adhering to GDPR compliance. The platform only requires read-only access to your bank account, ensuring your sensitive data remains protected at all times.
Can I use Banknaked with any bank?
Yes, Banknaked is designed to work with a wide range of banks that support Open Banking. This allows users to connect their accounts effortlessly and gain insights regardless of their banking provider.
Is there a cost associated with using Banknaked?
Banknaked offers a free initial setup that allows users to uncover hidden fees. While basic features are available at no cost, users can opt to upgrade for deeper insights and additional functionalities as needed.
How quickly can I set up my Banknaked account?
Setting up your Banknaked account is quick and straightforward. Users can connect their bank accounts in less than two minutes, allowing them to start uncovering hidden fees and managing their finances efficiently.
Dividend Data FAQ
How does the free tier work?
The free tier provides 2,500 credits per month, which do not expire and renew each month. No credit card is required to start. Each data point retrieved by a formula (e.g., one cell with a dividend yield) typically consumes one credit. This generous allowance allows for substantial usage for personal portfolio tracking and analysis, enabling users to experience and iteratively integrate the tool into their workflow at no cost.
What data can I access with the spreadsheet functions?
You can access over 100 key metrics including forward and historical dividends, ex-dividend dates, dividend yields, payout ratios, stock prices, PE ratios, EPS, full financial statement items (income statement, balance sheet, cash flow), and various other growth and valuation metrics. The 16 custom functions are designed to categorize this data intuitively for fundamental and dividend analysis.
Do I need to know how to code to use Dividend Data?
Absolutely not. Dividend Data is built specifically to require zero coding. You use it just like any native spreadsheet function (e.g., =SUM()). Simply type =DIVIDENDDATA_ and follow the formula syntax to pull data directly into your cell. The integration handles all the complex data fetching in the background, making professional analysis accessible through an interface you already know.
Does it work in both Google Sheets and Microsoft Excel?
Yes, Dividend Data offers fully functional add-ins for both Google Sheets (via the Google Workspace Marketplace) and Microsoft Excel (via Microsoft AppSource). The core experience and formula syntax are consistent across both platforms, allowing you to choose your preferred environment or even use both interchangeably while maintaining a continuous, iterative analysis process.
Alternatives
Banknaked Alternatives
Banknaked is a cutting-edge financial transparency tool that falls under the Business & Finance category. It is designed to help consumers uncover hidden banking fees that can accumulate unnoticed over time. Users often seek alternatives to Banknaked due to various reasons such as pricing, specific feature sets, or compatibility with different financial platforms. Finding the right tool requires evaluating factors like user interface, security measures, and the effectiveness of fee detection capabilities. It's essential to choose an alternative that aligns with your financial goals and offers a comprehensive understanding of your banking expenses. When exploring alternatives, consider what unique features they may provide, such as personalized recommendations, ease of use, and the level of security offered. Assessing customer reviews can provide insight into user experience and satisfaction. A good alternative should empower you to gain control over your finances, helping you save money while ensuring your data remains private and secure. Always prioritize tools that prioritize transparency and offer clear explanations of banking costs.
Dividend Data Alternatives
Dividend Data is a specialized financial data service that brings over 30 years of stock market history directly into spreadsheets. It falls into the category of tools designed for fundamental and dividend investors who prioritize ease of use and deep historical analysis without complex setups. Users often explore alternatives for various reasons, including specific budget constraints, the need for different feature sets like real-time alerts or broker integrations, or a requirement to use a platform other than Google Sheets or Excel. The search for the right tool is a continuous process of matching one's evolving investment strategy with available solutions. When evaluating any alternative, consider the depth and reliability of historical data, the simplicity of integration into your current workflow, and the overall value relative to cost. The goal is to find a service that not only meets your immediate data needs but also adapts to support your long-term analytical growth and iterative refinement of your investment process.