Zelma

About Zelma
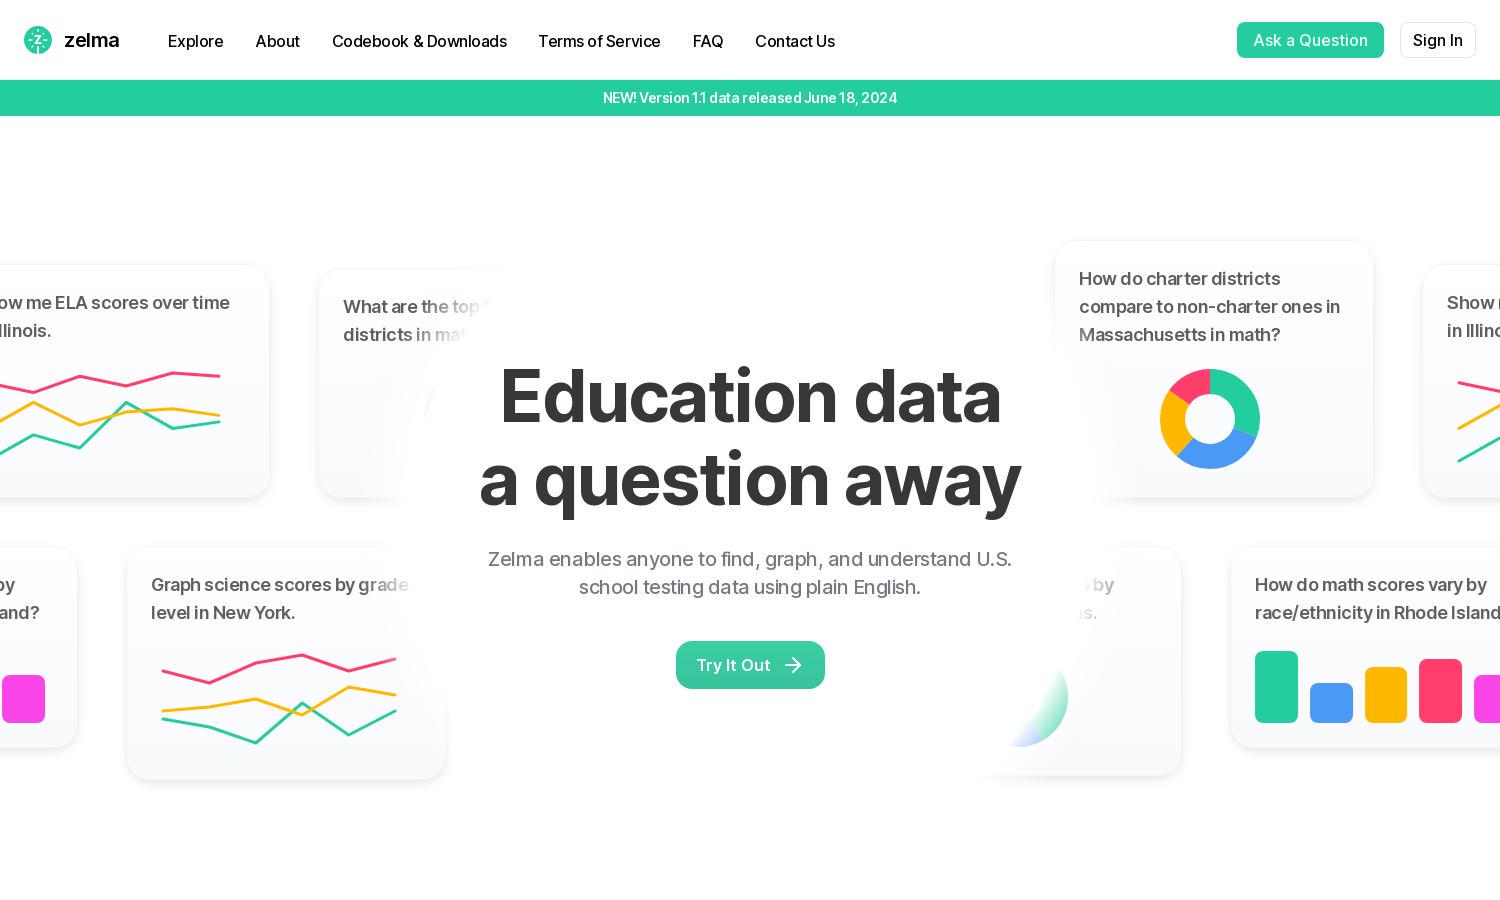
Zelma is an AI-powered platform designed to help users analyze U.S. school testing data effortlessly. With its intuitive interface, educators and researchers can easily input questions in plain English, receiving immediate insights through graphs and tables, simplifying the decision-making process based on reliable data.
Zelma offers flexible pricing plans, including a free tier for basic access and premium subscriptions for advanced features. Each plan is tailored to provide unique benefits, such as enhanced analytics capabilities and priority support, ensuring users can maximize their experience with the platform's extensive testing data.
Zelma features a clean, user-friendly interface that simplifies navigation and data exploration. The layout enhances the browsing experience, making it easy for users to access key features. This design emphasizes the site's functionality, allowing seamless interaction with visualized data and quick retrieval of insights.
How Zelma works
Users begin their journey with Zelma by creating an account and accessing the user-friendly interface. They can input their questions in plain English, directing the AI to the relevant data. Zelma subsequently processes the request, displaying results in visual formats like graphs and tables, empowering users to understand and interpret the data easily.
Key Features for Zelma
AI-driven data exploration
Zelma's AI-driven data exploration feature allows users to ask questions in plain English, instantly generating visual insights. This unique functionality streamlines the process of analyzing student test data, providing educators and researchers with the necessary tools to make informed decisions based on performance metrics.
Comprehensive testing comparisons
Zelma enables users to conduct comprehensive comparisons of test results across various demographics and districts. This feature enhances educational research by providing critical insights into performance disparities, helping stakeholders identify areas for improvement and facilitating targeted interventions for student success.
Dynamic data visualization
Zelma includes dynamic data visualization tools that transform complex student test data into easily interpretable graphics and charts. This functionality enhances user engagement and understanding, allowing users to pinpoint trends and anomalies, ultimately supporting data-driven decision-making in education.


